



When a WordPress site breaks, installing five random “fix” plugins usually makes diagnosis harder. I want tools that reduce uncertainty: show the failing query, expose PHP notices, isolate a plugin conflict, or make the debug log readable.
The five WordPress debugging plugins below solve different parts of that workflow. For SEO-specific incidents, pair debugging with WordPress SEO monitoring so you can detect the SEO change first and then investigate the underlying plugin, theme, request, or configuration issue. I would not leave every one active on every production site. Instead, pick the tool that matches the symptom and remove or disable heavy diagnostics when the investigation is finished.
Start With the Symptom, Not the Plugin
- Slow admin or page: inspect queries, hooks, HTTP requests, scripts, and responsible components.
- White screen or PHP fatal: enable logging and read the actual stack/error details.
- Intermittent warnings: make the debug log searchable and easier to monitor.
- Plugin or theme conflict: isolate components without changing what normal visitors see.
- Unknown server issue: check PHP, database, environment, and request information before changing code.
TL;DR: My WordPress Debugging Toolkit
- Query Monitor: best overall developer diagnostics for queries, PHP errors, hooks, scripts, HTTP requests, REST, and more.
- WP Debugging: best simple way to enable WordPress debug constants and inspect logs.
- Debug Log Manager: best for turning a noisy debug.log into searchable error groups.
- Error Log Monitor: best lightweight dashboard view of PHP error logs and email alerts.
- Troubleshooting: best for isolating plugin/theme conflicts for your own session without taking the live site apart.
Quick Comparison of WordPress Debugging Plugins
| Plugin | Primary job | Production caution | Pricing |
|---|---|---|---|
| Query Monitor | Deep request diagnostics | Collects lots of developer data | Free |
| WP Debugging | Enable debug settings/logs | Turn off when finished | Free |
| Debug Log Manager | Parse and inspect debug logs | Debug logs may contain sensitive details | Free |
| Error Log Monitor | Watch PHP logs in dashboard | Depends on server log configuration | Free |
| Troubleshooting | Isolate plugin/theme conflicts | Session-specific changes still need careful testing | Free |
Before testing risky code, make a staging copy. A good WordPress staging plugin gives you room to reproduce the failure without turning the production site into a laboratory.
1. Query Monitor — Best Overall Developer Debugger
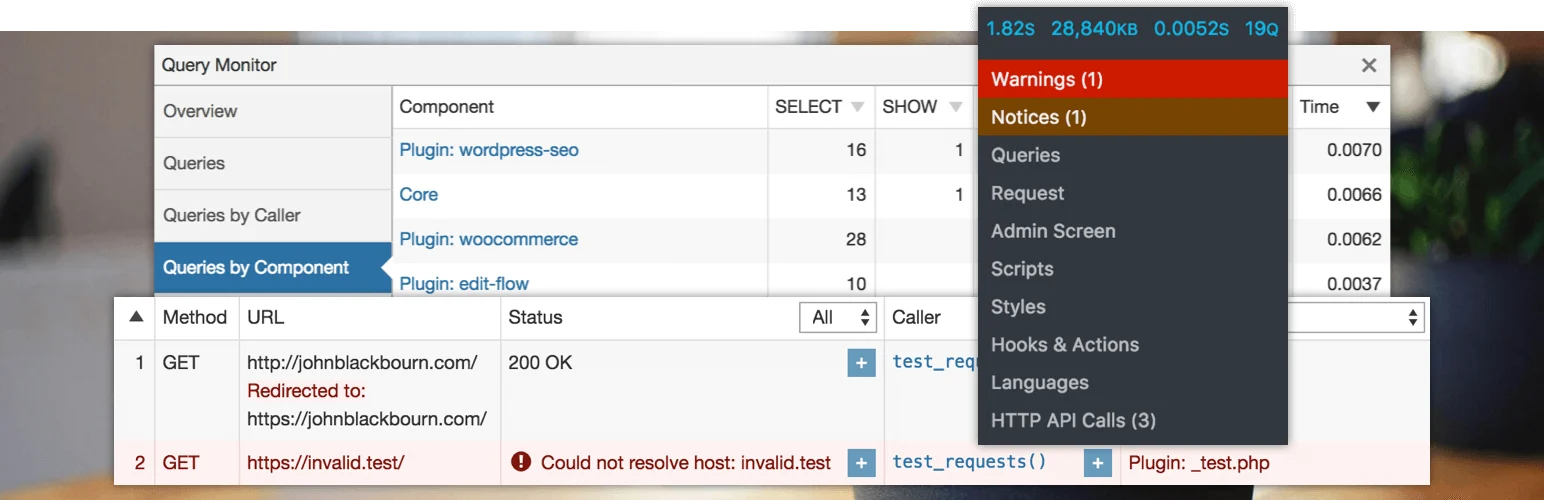
Query Monitor is the debugging plugin I reach for first when a WordPress request feels wrong but the cause is not obvious. It can inspect database queries, PHP errors, hooks, block editor data, enqueued scripts and styles, HTTP API calls, template loading, redirects, capabilities, REST requests, and more.
Its real value is attribution. Instead of only telling you that a query is slow, Query Monitor can group data by the plugin, theme, or function responsible. Version 4 also introduced a timeline-oriented interface that makes large diagnostic sets easier to interpret.
What it shows you
- Slow, duplicate, and erroneous database query inspection
- PHP errors with responsible component and call stack
- Hooks, actions, scripts, styles, and dependencies
- HTTP API and REST/AJAX debugging
- Template hierarchy and block information
- Environment, capability, rewrite, and redirect diagnostics
Pros: Extremely comprehensive, actively maintained, and free.
Cons: It is aimed at technical users and can expose a lot of data at once; avoid leaving heavy debugging active without a reason.
Pricing: Free.
Best for: Developers and advanced administrators diagnosing performance, code, query, or request problems.
2. WP Debugging — Best for Enabling WordPress Debug Mode

WP Debugging makes the official WordPress debug constants easier to manage without repeatedly editing wp-config.php. It is intentionally simple, which is exactly what I want when the site is already unstable.
It works well when you need WP_DEBUG, logging, and a quick way to inspect what WordPress is reporting. The plugin was updated in August 2026 and remains a useful bridge between WordPress debugging documentation and a practical admin workflow.
Core debugging features
- Enable WordPress debugging settings from the dashboard
- Configure common WP_DEBUG-related constants
- Quick access to debug output
- Simple activation/deactivation workflow
- Works with modern WordPress versions
- Minimal interface compared with full developer profilers
Pros: Simple, focused, and current; good for reproducing PHP warnings and notices.
Cons: It does not diagnose the root cause for you; debug output can expose sensitive paths or data if mishandled.
Pricing: Free.
Best for: Site owners and developers who need a clean way to switch WordPress debugging on and off.
3. Debug Log Manager — Best for Making debug.log Usable
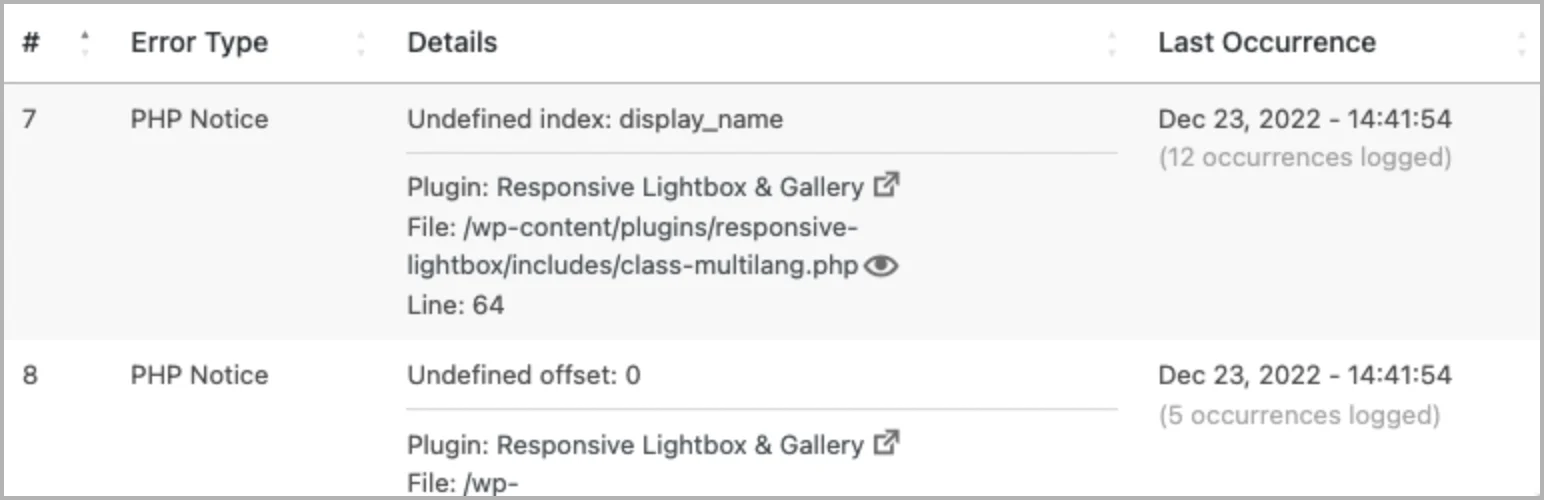
A raw debug.log can become thousands of repetitive lines. Debug Log Manager helps by enabling debugging, moving the log to a non-default location, parsing entries, and showing distinct errors with their most recent occurrence.
That is useful when the problem happens repeatedly but not on every request. Instead of scrolling through raw text, you can filter to the error pattern that matters and see whether it is still recurring.
Log-management features
- One-click WP_DEBUG logging controls
- Custom non-default log location and filename
- Import/continuation from an existing debug.log
- Grouped/distinct error view
- Search and filtering for log entries
- PHP, database, and JavaScript error logging support
Pros: Much easier to work with than a huge raw log file; security-minded log placement.
Cons: Still depends on WordPress/PHP logging behavior and should not be treated as a full performance profiler.
Pricing: Free.
Best for: Administrators investigating recurring PHP or WordPress errors over time.
4. Error Log Monitor — Best Lightweight Error Dashboard
Error Log Monitor puts recent PHP error-log messages in the WordPress dashboard and can email you when new errors appear. I like it when I already have server-side logging configured and only need a convenient window into that data.
It is less ambitious than Query Monitor, which can be an advantage. You get visibility into the log without turning every page request into a large diagnostic session.
Monitoring features
- Dashboard widget for recent PHP errors
- Works with existing PHP error logs
- Email notifications for logged errors
- Configurable log location support
- Lightweight monitoring workflow
- Useful for ongoing maintenance checks
Pros: Simple and low-friction once PHP logging is configured.
Cons: It cannot explain every error source and may require server/log-path configuration depending on hosting.
Pricing: Free.
Best for: Maintenance teams that want passive visibility into PHP errors.
5. Troubleshooting — Best for Plugin and Theme Conflicts

The standalone Troubleshooting plugin gives you a session-specific troubleshooting mode. It can disable plugins and switch to a default theme for your logged-in session while normal visitors continue to see the live configuration.
This is the safest way to answer the classic WordPress question: “Is this plugin conflict causing the problem?” You can reactivate components one at a time in your session until the issue returns, without globally disabling half the site.
Conflict-isolation features
- Session-specific troubleshooting mode
- Disable plugins for your session only
- Switch themes without changing the public site
- Re-enable components one by one
- Useful when staging is unavailable
- Designed around WordPress support troubleshooting practices
Pros: Excellent for conflict isolation without a public outage.
Cons: It is not a code profiler or log viewer, and you still need to understand the result of each test.
Pricing: Free.
Best for: Support, maintenance, and site owners isolating plugin/theme conflicts.
A Safer WordPress Debugging Workflow
- Reproduce the issue before changing anything so you know what “fixed” looks like.
- Take a backup or use staging for changes that affect PHP, plugins, themes, or the database.
- Use the narrowest diagnostic tool that answers the current question.
- Never display PHP errors publicly on a production site.
- Remove old debug logs and disable unnecessary debugging after the investigation.
- If you are testing snippets, use one of the safer WordPress code snippet plugins instead of editing functions.php blindly.
Conclusion
There is no single debugging plugin for every failure. Query Monitor gives the deepest request-level view, WP Debugging and Debug Log Manager make WordPress error output easier to work with, Error Log Monitor is good for passive PHP log visibility, and Troubleshooting is the cleanest conflict-isolation tool. Start with the symptom and use the smallest toolset that can prove the cause.
Frequently Asked Questions
What is the best WordPress debugging plugin?
Query Monitor is the best overall developer tool because it connects database queries, PHP errors, hooks, scripts, HTTP requests, templates, and responsible components in one interface.
Should WP_DEBUG be enabled on a live site?
You can log errors on production when necessary, but you generally should not display them to visitors. Keep debug output protected and disable unnecessary debugging after diagnosis.
How do I find which plugin is causing a WordPress error?
Use a staging site or a session-specific troubleshooting mode, then disable plugins and re-enable them methodically until the issue returns.
Can a debugging plugin slow down WordPress?
Yes. Deep profilers and query collectors add overhead. Use them during investigation rather than treating them as permanent frontend performance tools.
Where should I look after a mysterious admin change?
An activity log can help correlate a failure with plugin updates, settings changes, or user actions. See our WordPress activity log plugin comparison.

